
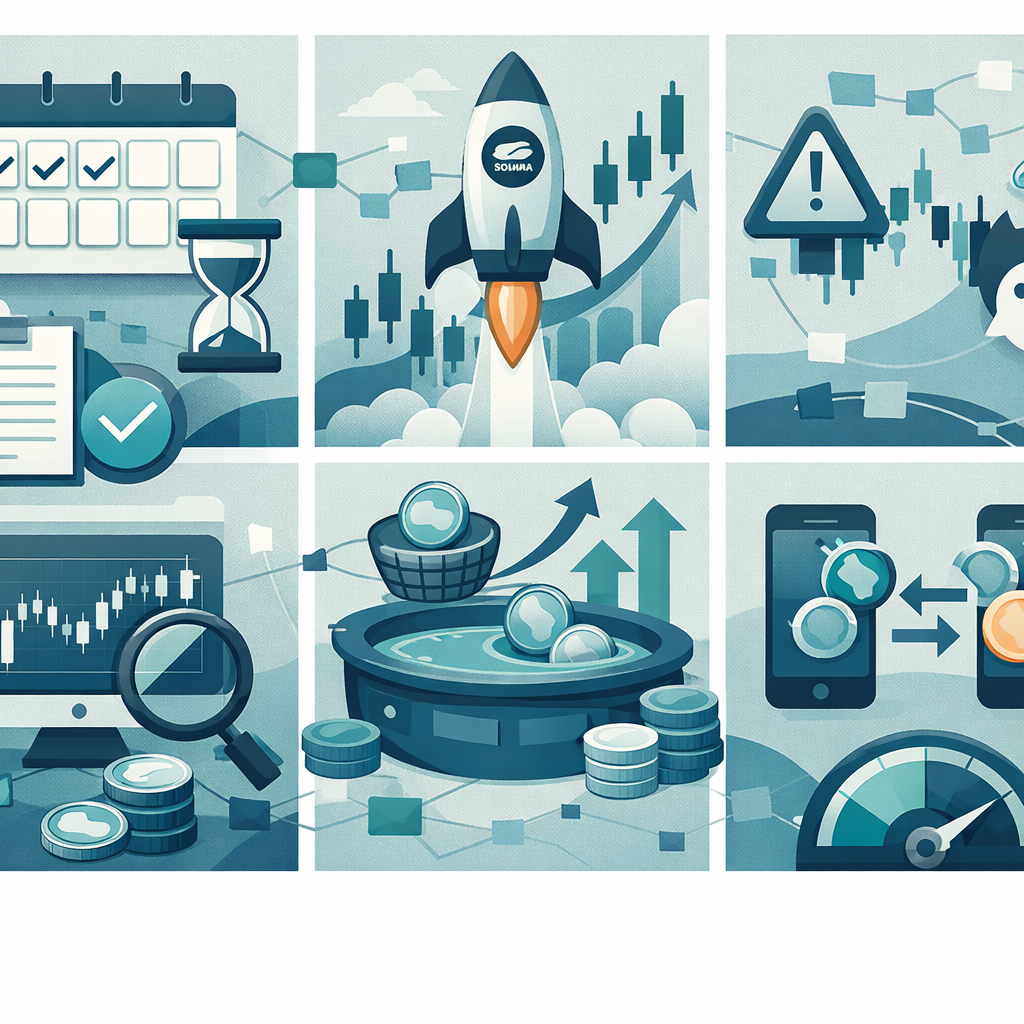
A practical DexScreener trending playbook for Solana tokens—what actually moves the needle, what to avoid, and how to pace volume for real momentum.
You’ve seen it happen: a brand-new Solana token shows up on DexScreener and suddenly it’s everywhere.
The chart looks alive. Trades keep printing. The “24H Vol” number climbs like a scoreboard.
And then you check their Telegram and think, “How did they get that much attention so fast?”
Here’s the honest truth: trending isn’t magic. It’s a system—and if you understand the signals DexScreener surfaces, you can engineer momentum instead of hoping for it.
Important note: nothing here is financial advice. And yes—artificial or manipulative trading can carry risks (exchange rules, reputation, legal/compliance depending on jurisdiction). The goal of this guide is to help you build credible market activity: consistent, paced volume, healthy liquidity, and clean execution—so your token looks like a real market, not a dead chart.
TL;DR (save this):
- DexScreener trending is driven by attention + activity, and the biggest visible proxies are volume, trade count, and price movement.
- The fastest way to lose momentum is spiky, obvious “one-wallet” volume. Pacing > blasting.
- If you want a token to look tradable, you need: tight spreads, steady prints, and enough liquidity that buyers don’t get wrecked on entry.
- A strong stack for Solana: volume pacing + rank support + social proof (reactions/engagement).
- Use tooling that gives you control and visibility: /dashboard, /calculator, and the right feature modules.
What DexScreener Trending Really Rewards (and Ignores)
Let’s make this simple.
DexScreener is not sitting there “judging your project.” It’s surfacing what looks active and what looks interesting.
That means you’re playing a visibility game. And visibility games have inputs.
The signals that usually matter most
On most DEX pairs, what stands out on DexScreener is:
- 24H volume (and how steadily it grows)
- Transaction count (buys and sells printing consistently)
- Price movement (not necessarily up-only, but alive)
- Liquidity (enough depth that the market doesn’t feel like a trap)
- Holder distribution (a chart full of whales scares off real buyers)
DexScreener also becomes a source for other platforms and communities. If your pair looks “real,” people share it. If it looks botted in a sloppy way, they clown it.
The stuff that doesn’t save you
You can’t “SEO” your way to trending with:
- A logo upgrade
- A prettier website
- A pinned tweet with 2,000 bought likes
- A single giant buy candle (followed by silence)
I’ve watched tokens do a $150,000 volume spike in 20 minutes…and still not convert into lasting attention because the chart went dead right after.
Momentum is a movie, not a screenshot.
Why “realistic volume” beats “max volume”
If you take only one idea from this article, take this:
DexScreener rewards consistency more than chaos.
A healthy chart looks like:
- Trades every 10–60 seconds (during your push windows)
- A mix of buys and sells (markets breathe)
- Volume that increases in a believable slope (not a vertical wall)
If you want a deeper foundation first, read: Complete Crypto Volume Bot Guide. It’ll help you understand why pacing and structure matter.
The 7-Day Solana DexScreener Trending Playbook

Think of this like launching a new café.
You don’t throw a party on day one and then close for six days.
You want a steady line out the door—especially during peak hours.
Below is a practical plan you can run whether you’re launching on Raydium/Jupiter routes or pushing an existing pair.
Day 0: Prep the chart so it can survive attention
Trending is useless if buyers click in and instantly get destroyed by slippage.
Before you push volume, make sure you’ve nailed:
- Liquidity depth: enough that a $200–$1,000 buy doesn’t move price by 10%+
- Spread sanity: wide spreads make charts look broken
- Basic token hygiene: verified socials, correct pair info, consistent ticker usage
If you’re building on Solana, it’s worth skimming the official docs for fundamentals like accounts/transactions so you understand what explorers and trackers see: https://solana.com/docs
The “minimum viable liquidity” rule of thumb
There’s no perfect number, but here’s a practical baseline many teams use:
- Micro launch: $3k–$10k liquidity
- Serious push: $15k–$50k liquidity
- Competitive meta: $50k–$200k+ liquidity
If your liquidity is $2,000 and you’re trying to print $200,000 in volume, the chart will look like a seismograph.
That scares off real money.
Day 1 (First 60 minutes): Establish “life signs”
DexScreener visitors decide in seconds whether they trust a chart.
Your goal in the first hour is not “moon.” It’s credibility.
What credibility looks like:
- 30–120 trades in the first hour (depending on your budget)
- Trades spread across time (not 50 swaps in 2 minutes)
- Buys and sells interleaved
This is where a dedicated trending-oriented stack helps.
If your goal is specifically DexScreener visibility, look at the DexScreener Trending Bot and pair it with controls from the main Features suite.
Day 1 (Hours 2–24): Pace volume like a streaming series
Here’s the pacing mistake I see constantly:
Teams do 80% of their volume budget in the first 2 hours.
Then they wonder why the pair falls off a cliff.
Instead, run volume in waves:
- Wave A: launch window (first hour)
- Wave B: follow-up push (hours 3–6)
- Wave C: evening prime time (hours 10–14)
- Wave D: final “keep alive” (hours 18–24)
Each wave should look like a normal market:
- Mixed trade sizes (e.g., $25, $40, $65, $110)
- Natural pauses
- No single wallet doing everything
If you’re new to this, read Solana Volume Bots 2025 Guide for a clean mental model of how volume automation is typically structured.
Days 2–3: Convert “chart attention” into social proof
DexScreener traffic is high intent.
People are literally looking for the next move.
But they still want reassurance that:
- You’re not going to vanish
- The community is real
- The chart isn’t purely synthetic
This is where social proof features matter.
A simple combo that works well:
- Consistent volume + clean chart
- Reactions/engagement to reduce the “ghost town” vibe
If your pair looks active but has zero social response, it feels off.
Consider adding DexScreener Reactions during your push windows so the listing doesn’t look abandoned.
Days 4–7: Stabilize the rank signals (without burning budget)
Week one is where most tokens die.
Not because they were scams—because the team ran out of structure.
Your goals here:
- Keep a baseline of activity (even small)
- Tighten liquidity management
- Reduce volatility spikes
This is also where ranking support becomes useful.
If you want to systematically climb and hold positions, look at the Solana Rank Bot as part of your longer-term visibility plan.
Tools, Budgets, and Mistakes That Kill Momentum
Let’s talk about the part nobody likes: cost and execution.
Because “trend” is a result, not a button.
A simple comparison (manual vs automation vs trending-focused)
Use this table to choose the approach that matches your reality.
| Approach | Best for | Typical outcome | Biggest risk | |---|---|---|---| | Manual trading + community shilling | Tiny budgets, learning phase | Inconsistent volume, uneven chart | Burnout + dead hours | | General volume automation | Consistent prints, believable activity | Better chart + improved conversions | Bad pacing can look fake | | Trending-focused stack (volume + rank + reactions) | Competing for visibility and screenshots | Higher chance to climb/hold attention | Requires planning + budget discipline |
If you’re weighing automation vs doing everything by hand, this article helps you decide without hype: Volume Bot vs Manual Trading.
Budgeting: what people actually do
I’ll give you realistic ranges I’ve seen teams use for Solana pairs (not promises—just common patterns):
- Testing phase: $20–$100/day in controlled volume pacing
- Push windows: $150–$500/day for 2–4 days around key moments
- Aggressive competitive push: $1,000+/day when battling crowded metas
The trick isn’t spending more.
The trick is spending at the right time.
To map a plan fast, use the Volume Calculator. It’s the easiest way to sanity-check how many trades, what sizing, and what pacing you can afford.
The 5 mistakes that scream “fake chart”
If you avoid these, you’re already ahead of most launches.
- Straight-line volume
If your chart prints the exact same size trades every 15 seconds for 6 hours, that’s not “healthy.” That’s a metronome.
- One-wallet dominance
If on-chain activity looks like one actor, buyers assume you can rug the whole market.
- No sells, only buys
Real markets have both. A chart with only green prints feels like a trap.
- Liquidity too thin for the volume
High volume + low liquidity often creates violent wicks.
Wicks kill trust.
- No dashboard discipline
Teams “set and forget,” then wake up to a chart that looks broken.
Use a control center. Your execution should be adjustable in real time.
That’s what the Dashboard is for—monitoring, pacing, and making changes before the market notices.
A clean execution stack (what I’d run if I were you)
If your goal is DexScreener visibility for a Solana token, a practical stack looks like:
- Start with core capabilities from SolanaVolumeBot.com
- Configure and learn controls via How To Use
- Add purpose-built visibility tooling:
Then keep it honest and structured with best practices (wallet separation, realistic pacing, and monitoring). If you want a checklist-style guide, this pairs well: Volume Bot Tips & Best Practices.
“But how do I know what settings to use?”
This is where most people overcomplicate it.
Instead of asking “What’s the perfect config?” ask:
- What does my liquidity support without wild slippage?
- What trade count looks normal for my market cap?
- What hours does my community actually show up?
A simple starting point for many new tokens:
- Trade sizes: small-to-medium (avoid identical sizing)
- Pacing: steady with breaks (waves)
- Distribution: multiple wallets/actors (don’t centralize the prints)
And remember: you’re not trying to fool sophisticated traders.
You’re trying to create a chart that matches what a real early market looks like.
DexScreener Reality Check: What Trending Can and Can’t Do
Trending can buy you attention.
It cannot buy you retention.
Once people click your pair, they’ll judge you on:
- Is the narrative clear in 10 seconds?
- Is the liquidity safe enough to enter?
- Is the community active enough to stick around?
If any of those are missing, volume just becomes expensive fireworks.
A good rule:
If you wouldn’t buy your own token after clicking DexScreener, strangers won’t either.
For reference and transparency, always use authoritative sources when you’re validating markets and listings. DexScreener itself is the first stop: https://dexscreener.com/
A quick, practical “Launch Day” checklist you can steal
Before your push:
- Confirm correct pair and ticker
- Set baseline liquidity (don’t underfund)
- Prepare your waves (3–4 windows)
- Decide your acceptable volatility range
During your push:
- Monitor pacing in Dashboard
- Adjust trade sizing if chart looks robotic
- Watch for wicks; reduce aggression if slippage spikes
After your push:
- Keep a smaller baseline (don’t go silent)
- Add social proof if the listing looks empty
- Review what converted into real holders
If you want to support holder optics alongside chart activity, consider the Holder Booster as part of a broader token marketing plan (especially for early-stage tokens where distribution optics matter).
Related Reading (recommended next)
Ready to trend without guessing?
If you want a chart that looks tradable, a plan that doesn’t blow your budget in hour one, and tooling you can actually control, start here:
- Explore the full toolkit on /features
- Price out a realistic push on /pricing
- Build your plan with the /calculator
- Then execute and monitor in your /dashboard
If you want help choosing the right setup for your token and chain, reach out directly: /contact.

Written by
Ready to Boost Your Token?
Join thousands of successful projects using our advanced Solana Volume Bot platform. Increase your token's visibility, attract investors, and dominate the trending charts.
More from Solana Volume Bot
PancakeSwap Volume Bot Strategy for BNB Tokens
A practical PancakeSwap (BNB Chain) volume bot playbook: budgets, settings, risk controls, and visibility tactics that actually hold up.

Jupiter Volume Bot Strategy for Solana: Real 2026 Guide
A practical Jupiter volume strategy that looks organic: pacing, trade sizes, wallet setup, and what to monitor so you don’t trip obvious red flags.

CoinMarketCap Listing for Solana Tokens (2026)
A practical 2026 playbook to get your Solana token listed on CoinMarketCap: requirements, data sources, liquidity, timelines, and a proven checklist.